Percentage of households with access to an improved source of water by local municipality (STATS SA, 2024)
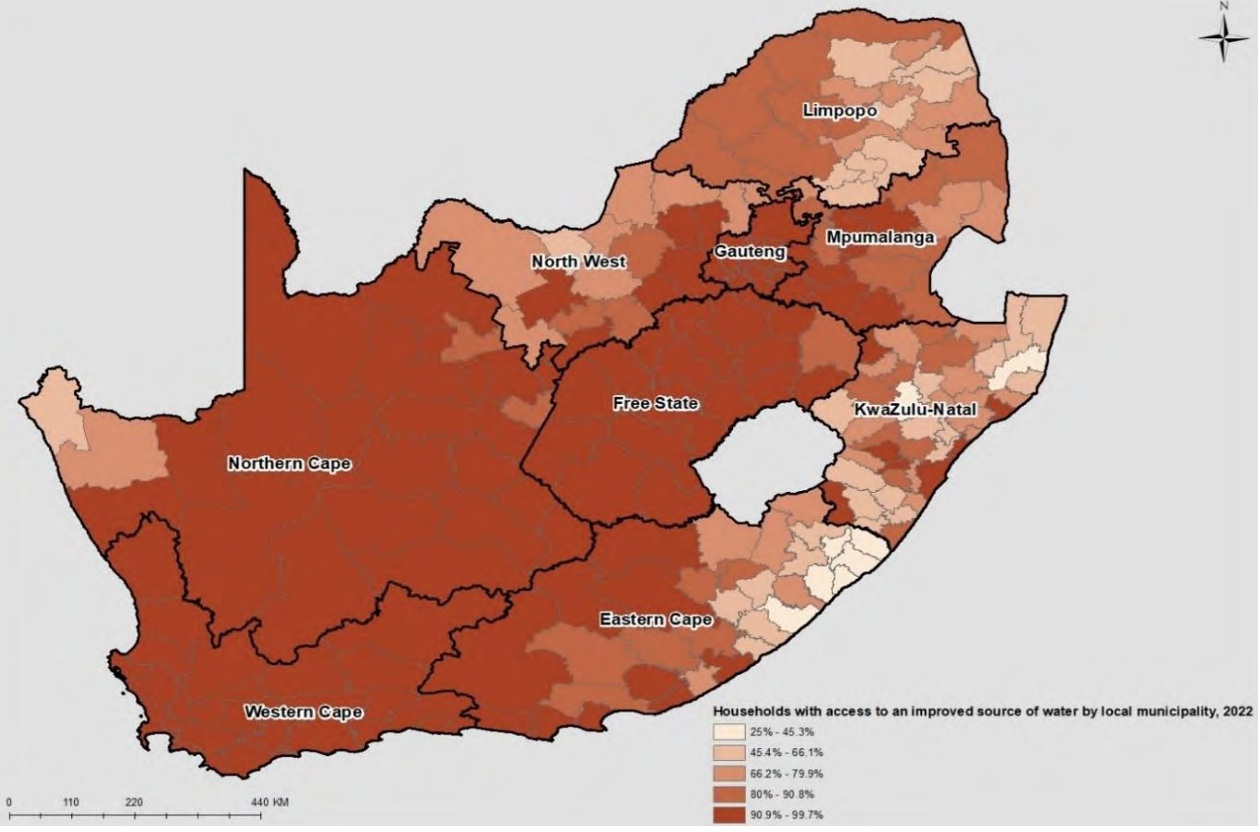
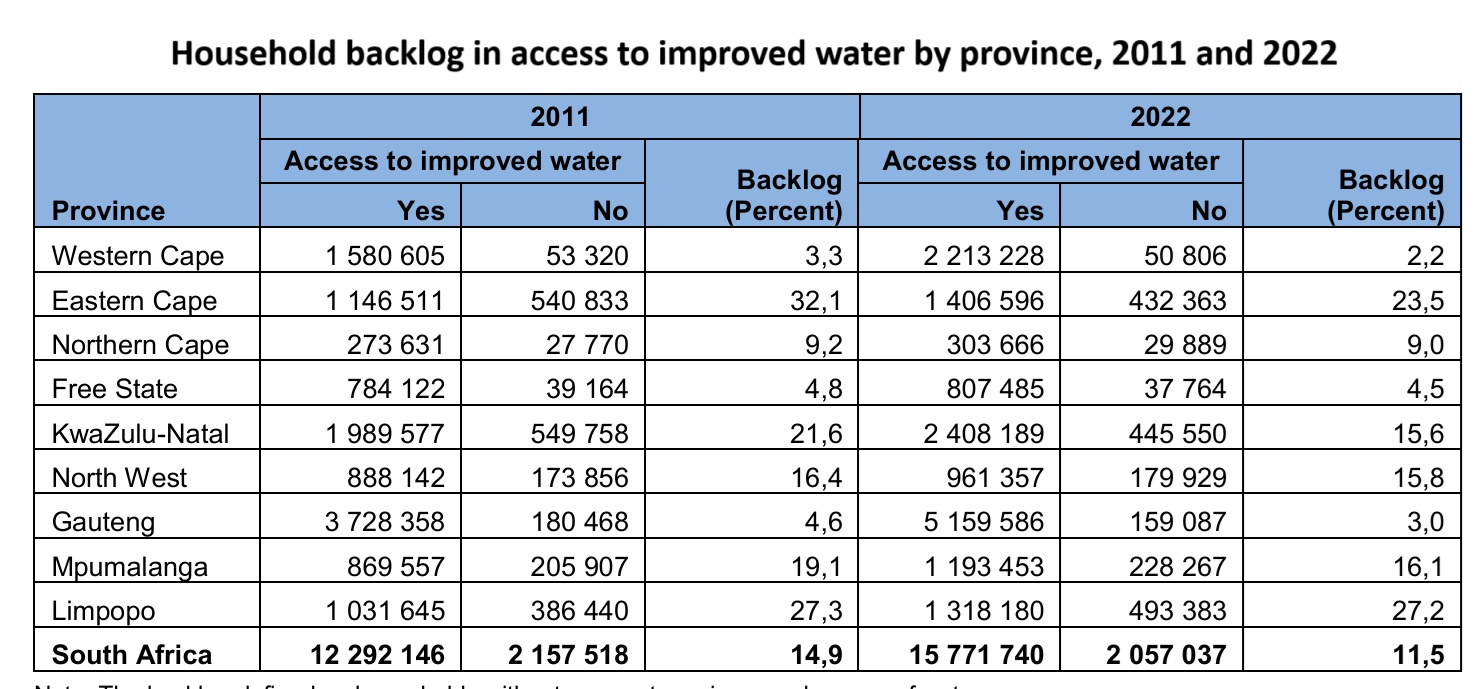
The backlog in the provision of piped water is calculated as households without access to an improved source of water as a percentage of all households in a province. In this table there are 2,1 million households (11,5% of all households) in the country that did not have access to an improved source of water in 2022. The lowest backlog was noted in Western Cape (2,2%) while the highest backlogs were observed in Limpopo (27,2%), Eastern Cape (23,5%) and Mpumalanga (16,1%). Households in municipalities with the higher backlogs suffer high water security challenges. This is accounted for in calculating water security index (WSI).
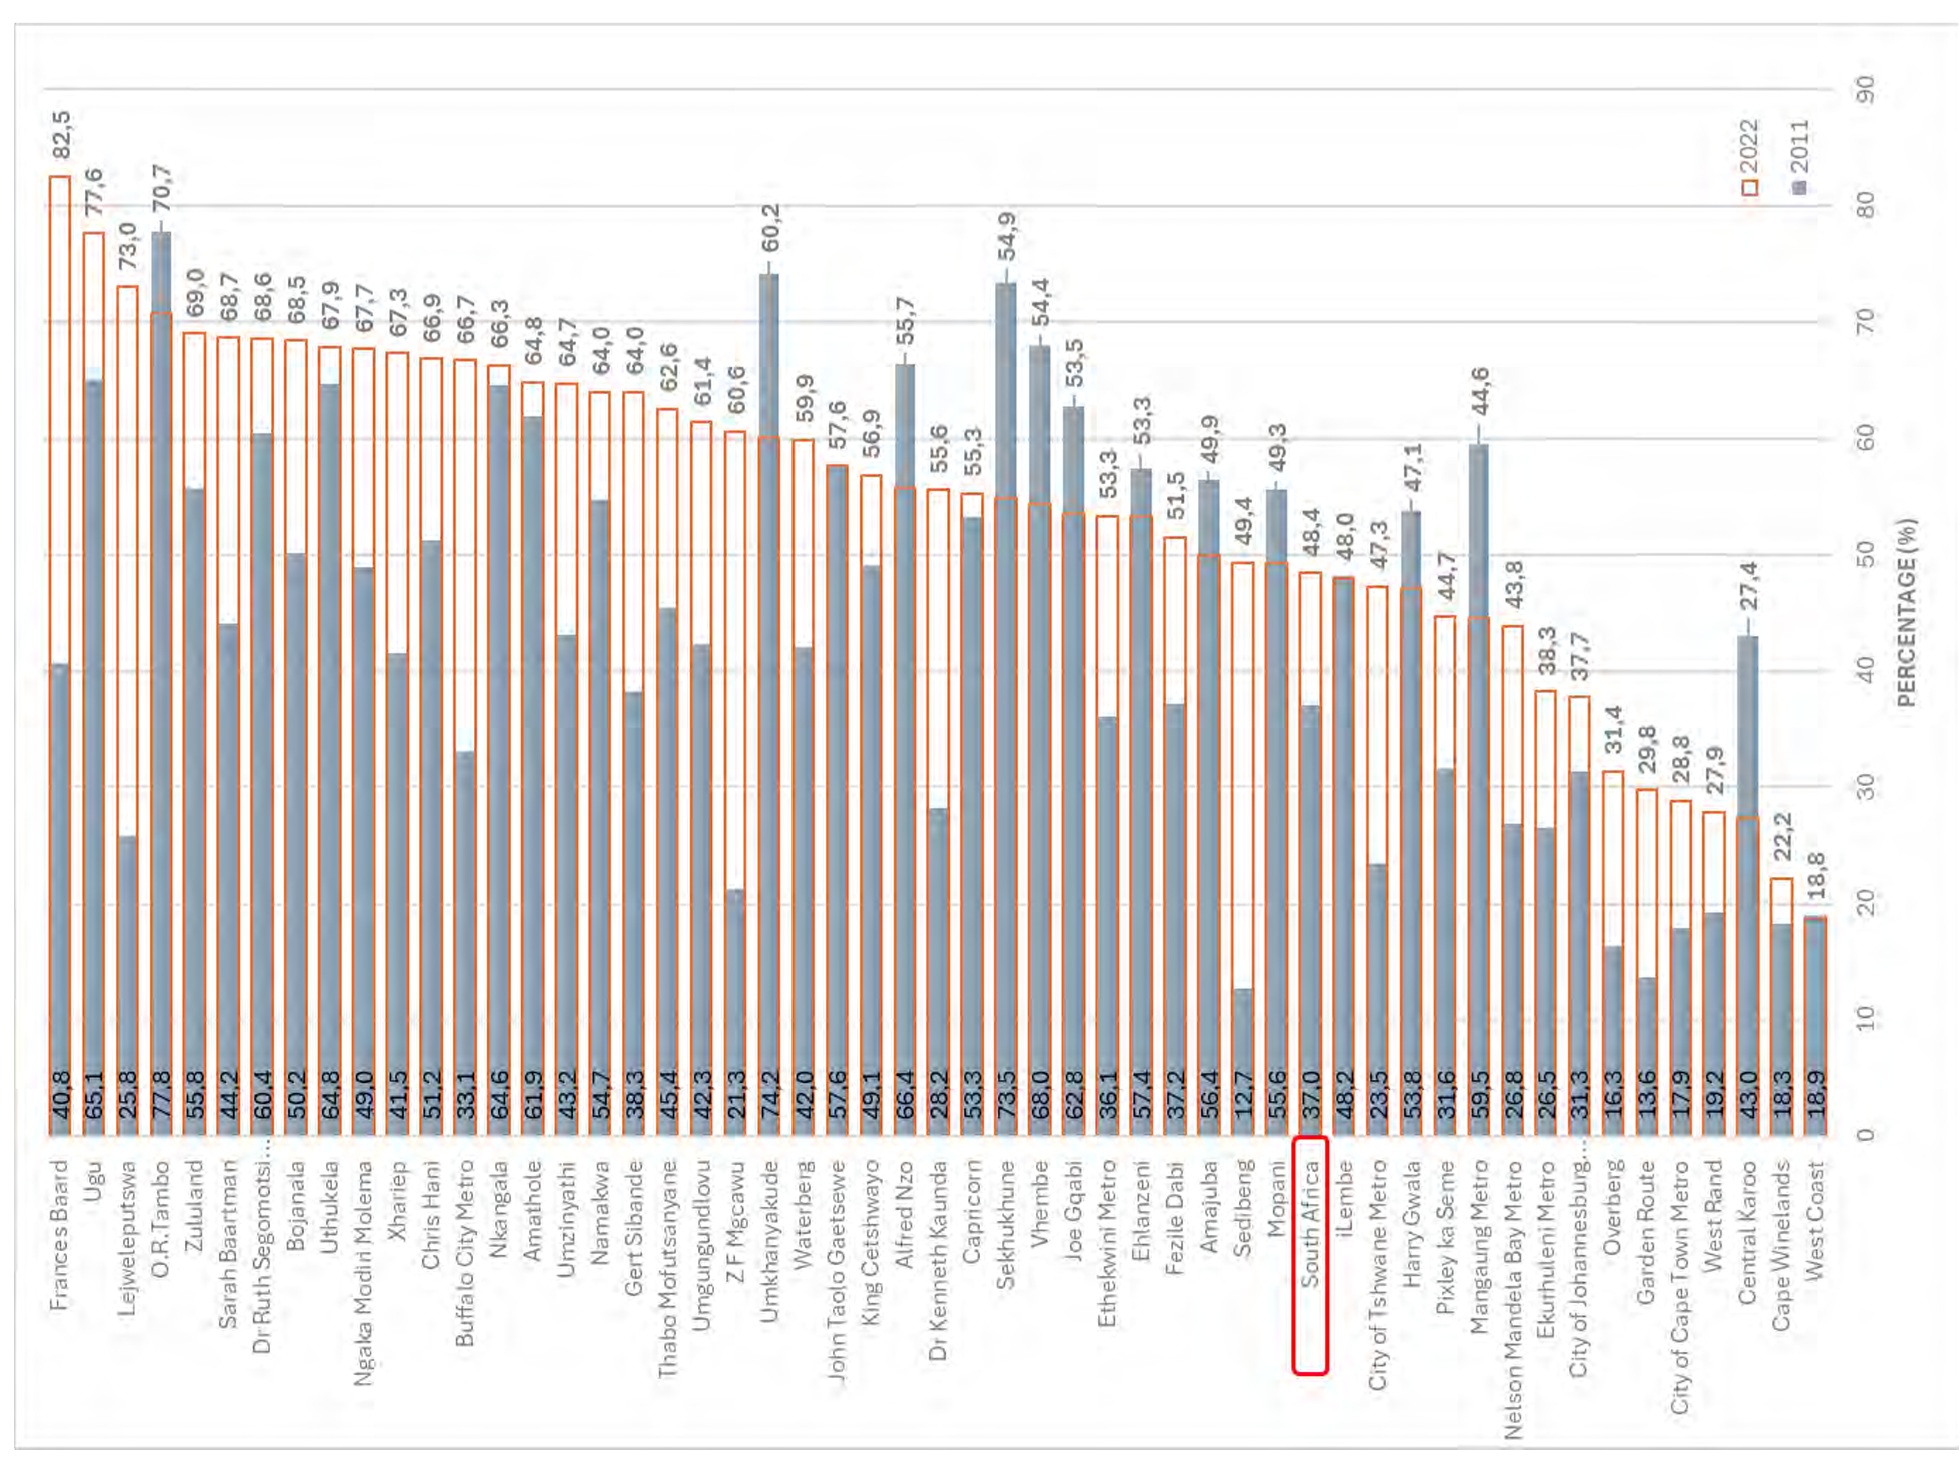
A comparison of the 2011 and 2022 data shows that the percentage of households that experienced water interruptions increased in all but 14 metropolitan and district municipalities during this time. The largest increases took place in Lejweleputswa (+47,2 percentage points), Frances Baard (+41,8 percentage points) and ZF Mgcawu (+39,3 percentage points). Inversely, the largest declines were observed in Sekhukhune (-18,5 percentage points), Central Karoo (-15,6 percentage points), and Mangaung Metro (-15,0 percentage points).