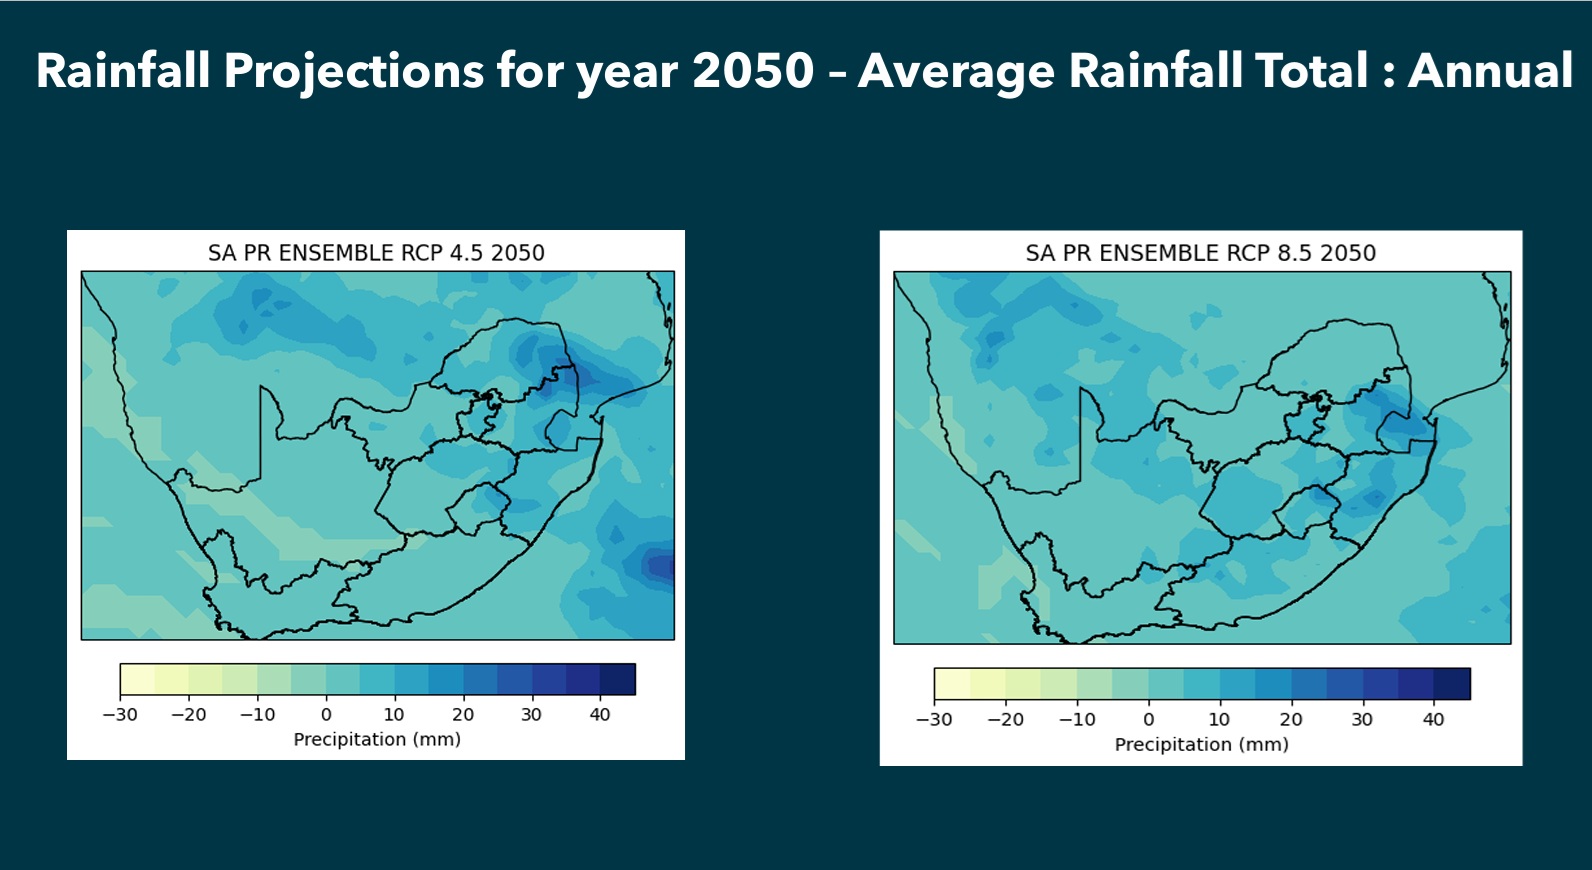
These climate change maps are developed by the South African Weather Service (SAWS) using ensemble models under the CMIP5 framework. The data is processed using a technique called dynamical downscaling to improve resolution to about 50 km. Two scenarios are explored: RCP 4.5 (moderate emissions) and RCP 8.5 (high emissions).
The rainfall projection map shows average expected changes in annual precipitation under both emission scenarios. Similarly, the temperature map projects the average increase in surface temperatures across the country by 2050.
Models used were verified against historical data (1979-2005) and showed strong performance, especially for temperature. Rainfall simulations tend to slightly overestimate values in some regions, but are still useful for long-term planning and water security evaluations.