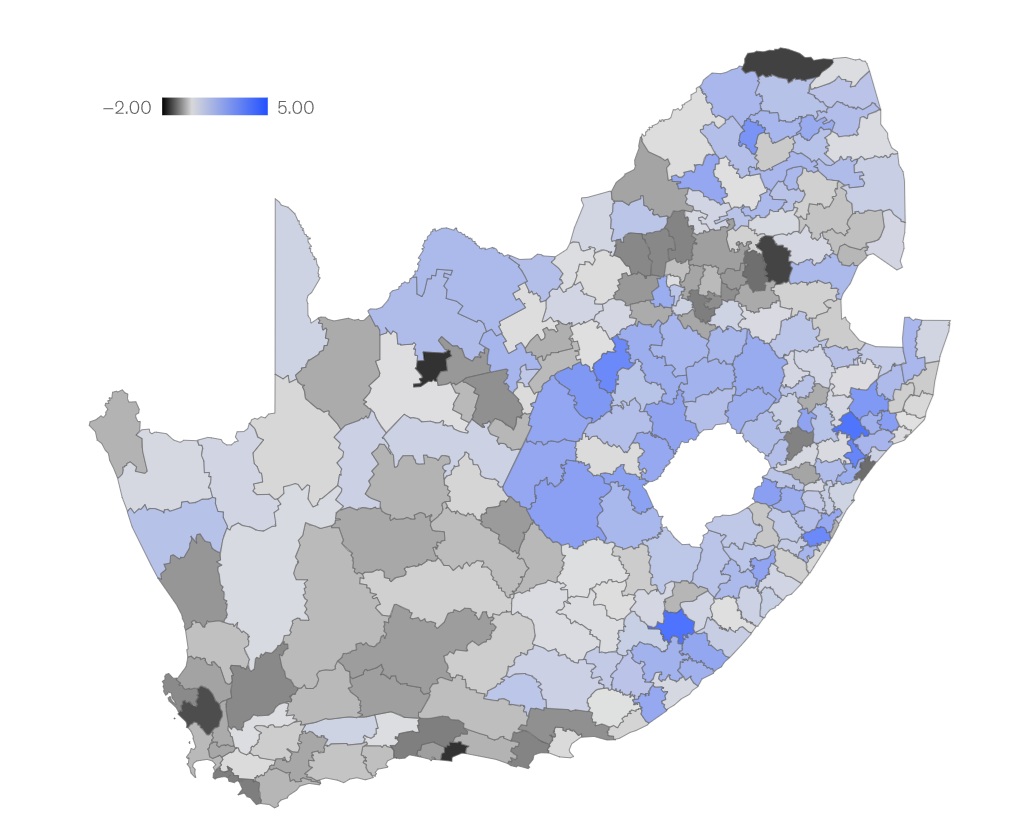
This map reflects insights from the McKinsey Global Institute (2023) report titled Anything but average. It highlights income growth by subnational microregions across South Africa. Unlike national averages, these granular insights, using methods like satellite-based luminosity, show varied progress-especially in regions where infrastructure and water access are improving.
The second map shows income-based poverty rates using SAMPI data from Statistics South Africa comunity Survey in 2016. Survey was done across local municipalities. Rural municipalities-often with weak infrastructure and low water access-have the highest poverty headcounts. This affects not just livelihoods but the ability of municipalities to deliver essential services like water.